
How Career Assessments Are Scored: A 2026 Guide

Discover how career assessments are scored and learn how to interpret results confidently. Transform scores into smart career choices today!
TL;DR:
- Career assessments compare responses to a norm group using percentile ranks and scaled scores. These scores guide career decisions by reflecting tendencies across interests, aptitudes, and personality traits. Interpreting them as ranges and considering the norm group ensures accurate understanding and effective exploration.
Career assessments are scored by comparing your responses to a norm group using percentile ranks, scaled scores, and standardized metrics to reveal how your strengths and interests align with potential careers. Understanding how career assessments are scored is not just a technical detail. It is the difference between reading your results with confidence and walking away confused by numbers that seem to mean nothing. This guide breaks down every major scoring method, explains what affects your results, and shows you how to turn those scores into real career decisions.
How are career assessments scored?
Career assessments use norm-referenced scoring as their primary method. Your responses are not graded against a perfect score. They are compared to a representative sample of people called a norm group, and your position within that group determines your score.

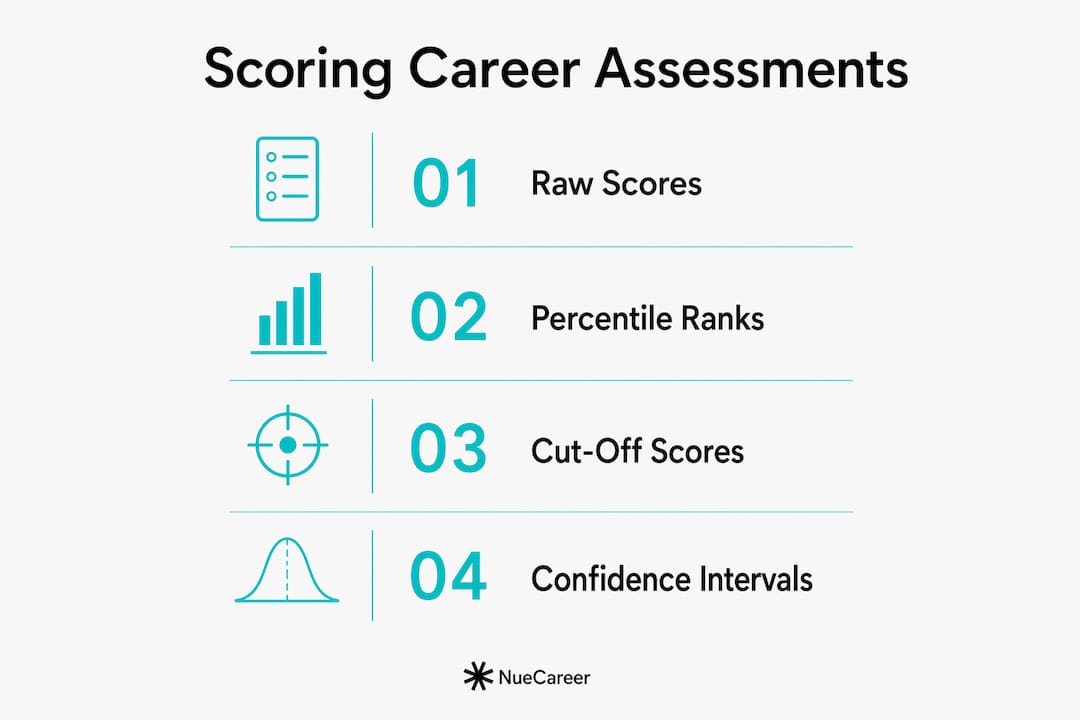
The most common output is a percentile rank. A percentile of 72 means you scored higher than 72% of the norm group, with a typical standard error of around plus or minus 5 points. That margin matters, and we will return to it shortly.
Most assessments do not stop at raw percentiles. Providers convert raw responses into scaled scores first, then into percentiles. Scaled scores adjust for question difficulty, so your result stays comparable whether you took one version of a test or another. This is the same logic behind standardized college entrance exams.
Beyond percentiles, you will encounter three other standardized score types:
- T-scores run on a scale of 10–90, with a mean of 50 and a standard deviation of 10. A T-score of 60 places you one standard deviation above average.
- Stanines compress results into a 1–9 scale. Stanine scoring groups people broadly, which reduces the temptation to over-interpret small differences between scores.
- Sten scores work similarly to stanines but use a 1–10 scale, common in personality assessments used in career counseling.
Raw scores alone are often misleading. Raw percent correct diverges sharply from percentile ranks on difficult tests. Scoring 65% correct could place you at the 85th percentile if the test was hard. That is why percentile ranks are the standard output most career professionals rely on.
Some assessments also use cut-off scores. Fixed cut-offs provide consistency for large employers, while floating cut-offs adjust based on the quality of the applicant pool. Investment banks, for example, use floating cut-offs to manage variation in applicant strength across hiring seasons.
How do norm groups and confidence intervals shape your results?
The norm group is the hidden variable in every career assessment score. Your percentile rank is only meaningful relative to the population it was built from. A 75th percentile score against a general population norm means something very different from the same percentile among elite professionals in a specialized field. Always check which norm group your assessment used.
Norm groups can also introduce bias when they are narrow or unrepresentative. Tests normed on biased samples can produce misleading percentile ranks. If the norm group does not reflect people like you in terms of background, education level, or professional experience, your score may not tell an accurate story.
Confidence intervals add another layer of nuance. Every score carries a standard error of measurement. A score with a standard error of 5 points means your true score likely falls within a 10-point confidence band. A result of 70 could realistically represent anything from 65 to 75.
This is why rigid cutoffs based on a single score point are statistically unjustified. Two people with scores of 68 and 72 may have identical underlying ability when measurement error is factored in.
Pro Tip: When you receive your results, ask whether the report includes a confidence band or score range. If it shows only a single number, mentally add and subtract the standard error before drawing conclusions.
The practical takeaway is simple. Treat your score as a range, not a fixed label. This mindset protects you from both over-confidence and unnecessary self-doubt.
What dimensions do career assessments measure, and how is each scored?
Career assessments rarely measure just one thing. Most combine three core dimensions: interests, aptitudes, and personality traits. Each uses a different scoring approach.
Interests
Interest assessments, like those built on Holland's RIASEC model, measure how strongly you identify with six occupational themes: Realistic, Investigative, Artistic, Social, Enterprising, and Conventional. The Strong Interest Inventory uses standard scores compared against a large representative sample. Scores above 54 align strongly with a given interest theme, and occupational scales compare your profile to satisfied workers in specific fields. This is one of the most research-backed scoring frameworks in career development.
Aptitudes
Aptitude tests measure natural ability in areas like verbal reasoning, numerical reasoning, and spatial thinking. Scoring here is objective: right or wrong answers produce a raw score, which is then converted to a scaled score and finally to a percentile. These tests are the most straightforward to score, but the norm group still determines what your percentile actually means. You can learn more about how these tests work in Nuecareer's guide to career aptitude tests.
Personality traits
Personality assessments, including Big Five models and behavioral style inventories, use standardized scales like stanines or sten scores. Responses are not right or wrong. They are placed on a spectrum and compared to norm group distributions. The goal is to describe tendencies, not rank performance.
The table below shows how each dimension differs in scoring approach:
| Dimension | Scoring method | Output type |
|---|---|---|
| Interests | Standard scores vs. norm sample | Theme scores, occupational scales |
| Aptitudes | Raw score converted to percentile | Percentile rank, scaled score |
| Personality | Stanines or sten scores | Trait profile, behavioral style |
Combining career interests with aptitude results produces a more accurate picture than either dimension alone. Interests tell you what you want to do. Aptitudes tell you what you are naturally capable of. Together, they narrow your options to careers that fit both your drive and your strengths. Nuecareer's overview of career assessment tools explains how multi-dimensional results are generated across leading platforms.
How can you interpret your scores to make better career decisions?
Understanding career test results requires a shift in mindset. Your scores are not a verdict. They are a starting point for exploration. Career experts warn against rigid reliance on test outputs and encourage active exploration alongside scores, including informational interviews and hands-on experience.
Here is a practical framework for interpreting your results:
- Look for repeated themes. If your interest scores, personality profile, and aptitude results all point toward working with people and ideas, that pattern carries more weight than any single number.
- Combine dimensions before deciding. A high score in Investigative interests means more when paired with strong analytical aptitude scores. One dimension alone is incomplete.
- Treat scores as tendencies, not limits. A lower score in a particular area does not close a door. It tells you where you may need more development or support.
- Use scores to guide research, not replace it. Book an informational interview with someone in a field your scores highlight. Shadow a professional. Read about the day-to-day reality of roles that appear in your results.
- Avoid "What If" paralysis. Spending too much time questioning whether your scores are accurate keeps you stuck. Accept the range, note the themes, and take one concrete step forward.
Pro Tip: Print or screenshot your full score report and highlight every theme that appears in more than one dimension. That overlap is your most reliable signal.
Assessment results are one facet of career decision-making, not the whole picture. Your personal values, life experiences, and goals belong in the conversation too. Scores give you data. You provide the context. For adults who want to act on their results, Nuecareer's article on why career quizzes help adults offers practical next steps. If personality data is central to your results, the guide on finding your career path by personality adds useful depth.
Building on your assessment results with skills like Spanish proficiency can also expand the range of careers your scores point toward, particularly in fields where bilingual ability is a competitive advantage.
Key Takeaways
Career assessment scores are most useful when treated as ranges that describe tendencies across multiple dimensions, not as fixed labels that define your ceiling.
| Point | Details |
|---|---|
| Percentile ranks are the standard | A percentile compares you to a norm group, not to a perfect score. |
| Norm groups change score meaning | The same percentile means different things against different reference populations. |
| Scores are ranges, not fixed values | A standard error of 5 points creates a 10-point confidence band around any result. |
| Combine dimensions for clarity | Interests, aptitudes, and personality scores together reveal more than any single measure. |
| Use scores to explore, not conclude | Treat results as a starting point for research, interviews, and hands-on experience. |
What I have learned from years of watching people misread their scores
The most common mistake I see is treating a career assessment score like a grade. People see a low percentile in one area and immediately decide that career path is off the table. That is not how these tools work, and it is not how careers work either.
Scores describe where you are right now relative to a specific group. They do not predict what you are capable of becoming. I have seen people with modest aptitude scores in numerical reasoning build strong careers in finance because they were relentless about developing that skill. The score flagged a gap. They closed it.
The second mistake is ignoring the norm group entirely. A 60th percentile score among general population norms is a very different result from a 60th percentile score among working engineers. Most assessment reports bury this detail in a footnote. Read it.
The third mistake is waiting for a perfect score before taking action. Interpreting career assessments well means accepting that results describe tendencies and using them to move forward, not to find certainty. Career development is exploratory by nature. Your scores are a compass, not a contract.
— Shane
Nuecareer's 7-minute quiz puts scoring to work for you
Most career assessments hand you a report and leave you to figure out what it means. Nuecareer takes a different approach.

The 7-minute career quiz uses norm-referenced scoring to compare your strengths, interests, and work style against real career profiles. It does not just give you numbers. It translates those numbers into specific career paths you may never have considered, along with personalized roadmaps, a 24/7 coaching chat, and resume tools built around your results. If you have ever finished a career assessment and thought "now what?", Nuecareer answers that question directly.
FAQ
What is a percentile rank in a career assessment?
A percentile rank shows how your score compares to a norm group. A percentile of 72 means you scored higher than 72% of the people in that reference sample.
Why do two people with similar scores get different career recommendations?
Different assessments use different norm groups and weight dimensions differently. The same percentile can imply different ability levels depending on the reference population used.
What is a standard error of measurement?
The standard error of measurement is the margin of statistical uncertainty built into every score. A standard error of 5 points means your true score likely falls within a 10-point range around your reported result.
How do stanines differ from percentile ranks?
Stanines compress scores into a 1–9 scale, grouping people broadly to reduce over-interpretation of small differences. Percentile ranks offer finer granularity but carry the same underlying measurement error.
Should I retake a career assessment if I disagree with my results?
Retaking the same assessment shortly after rarely changes results significantly. A more useful step is to combine your scores with informational interviews and hands-on exploration to test whether the results reflect your real-world experience.