

Most data analysts in the U.S. earn within a broad range around $70,000 to $122,000 a year, with a median typically estimated between $86,000 and $93,000, depending on the dataset. The biggest swing factors tend to be experience, location, and industry, in that order. If you want a number tied specifically to your background, NueCareer's 7-Minute Career Quiz can benchmark your strengths against roles that actually pay more.
TL;DR:
- Data analysts with five or more years of experience typically earn between $99,100 and $123,018 annually, depending on industry and location.
- Salaries in high-cost tech and finance hubs like San Francisco and New York can be 20% to 30% above the national median.
- Industry choices significantly impact pay, with tech, finance, and SaaS companies offering the highest ceilings.
- Location-based pay adjustments are common for remote roles, so clarify the pay band tied to your geographic jurisdiction before negotiating.
Table of Contents
- What Do Data Analysts Actually Make in the US?
- How Does Pay Change From Entry-Level to Senior Data Analyst?
- Which US Cities Pay Data Analysts the Most?
- Do Some Industries Pay Data Analysts More Than Others?
- What Counts as Total Compensation for a Data Analyst?
- Which Skills and Certifications Raise Data Analyst Pay the Most?
- How Do You Negotiate a Higher Data Analyst Salary?
- Why Salary Data Alone Won't Get You a Raise
- Turn Your Salary Benchmark Into a Real Plan
- Where This Salary Data Comes From
- Sources
- FAQ
What Do Data Analysts Actually Make in the US?
Ask four salary sites for a data analyst's pay and you'll get four different answers, and none of them are wrong.
Glassdoor puts median total pay at about $93,057 a year, with a 25th to 75th percentile range of $71,949 to $121,522, and top earners near $153,533. Indeed reports an average base salary closer to $86,686, spanning a low of $53,773 to a high of $139,744. ZipRecruiter's figure is lower still, with average pay near $82,640 and a median around $76,600, illustrating the wide pay spread within the role.
The gap comes down to methodology. Glassdoor and ZipRecruiter rely on self-reported pay from employees, Indeed leans on data pulled from job postings and employer listings, and Salary.com blends employer-reported compensation surveys. Each catches a different slice of the market, and none of them is measuring the exact same population of workers.
- Glassdoor: median $93,057, range $71,949 to $121,522
- Indeed: average $86,686, range $53,773 to $139,744
- ZipRecruiter: average $82,640, median ~$76,600
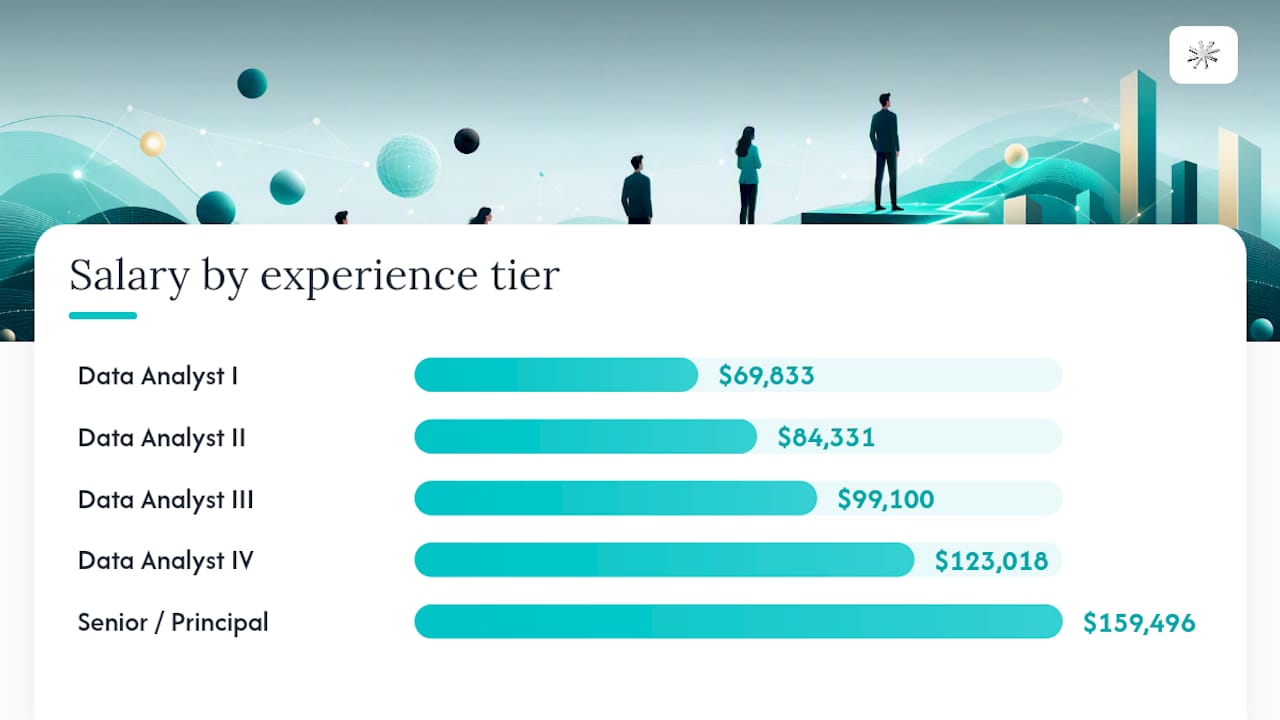
- Salary.com: progression bands from $69,833 (entry) to $159,496 (senior/principal)
A simple rule of thumb: those new to the field often earn nearer the lower quartile of these ranges, while professionals with five or more years of relevant experience typically earn near or above the median.
How Does Pay Change From Entry-Level to Senior Data Analyst?
Experience is the single biggest lever on your paycheck, and the jump between levels is steeper than most people expect. Salary tracks five distinct tiers, and the pay gap between the bottom and top of that ladder is more than double.
- Data Analyst I (0 to 2 years): average around $69,833. You're building SQL fluency, cleaning data, and producing standard reports.
- Data Analyst II (2 to 4 years): average around $84,331. You're now owning dashboards and fielding stakeholder questions independently.
- Data Analyst III (4 to 7 years): average around $99,100. You're leading analysis on cross-functional projects and mentoring juniors.
- Data Analyst IV (7-plus years): average around $123,018, with senior/principal-track analysts reaching $159,496. You're setting analytics strategy, not just executing it.
The jump from level to level rarely happens automatically. It gets triggered by visible impact, like a project that saved money, sped up a process, or changed a real business decision.
Pro Tip: Keep a running log of every project's measurable outcome, not just what you did. "Rebuilt the churn dashboard" is forgettable. "Rebuilt the churn dashboard, cutting reporting time from six hours to 40 minutes weekly" is a promotion case.
Which US Cities Pay Data Analysts the Most?
Location still moves the needle, even in a hybrid work era. Employers in high-cost tech and finance hubs pay more, and not always just to offset rent.
- San Jose/San Francisco Bay Area: often 20% to 30% above the national median, driven by tech-company density and competition for talent.
- New York City: strong premium tied to finance and media analytics roles.
- Seattle: elevated by big tech employers with deep analytics teams.
- Boston: healthcare, biotech, and education-sector analytics pull pay upward.
Some of that premium is pure cost-of-living adjustment; some of it reflects a genuinely tighter local talent market. Many employers now apply location-based pay bands, so a "remote" offer from a San Francisco company may still be scaled to your home state's cost of living rather than the Bay Area rate. If you're negotiating a remote role, ask directly which location tier your offer is anchored to before you compare it against national averages.
Do Some Industries Pay Data Analysts More Than Others?
Industry explains a meaningful chunk of the variance you'll see between two people with identical titles and years of experience. Glassdoor's data consistently shows tech, finance, and product-driven companies at the top of the pay curve, largely because analytics work there ties directly to revenue decisions.
- Tech and SaaS: highest ceilings, especially for analysts embedded in product teams.
- Finance and insurance: strong pay tied to risk and revenue analytics.
- Consulting: high variance, but top firms pay well for client-facing analytical work.
- Healthcare: growing demand, moderate pay, often offset by strong benefits.
Specialized titles like analytics engineer or product analyst tend to out-earn a generic "data analyst" role, and Levels shows those ceilings can run noticeably higher. Company size matters too. A 50-person startup and a Fortune 500 company can pay wildly different amounts for the same job title.
What Counts as Total Compensation for a Data Analyst?
Base salary is only part of the picture, and ignoring the rest leaves real money on the table. Compensation packages at tech and finance companies often include cash bonuses, RSUs or equity grants, and benefits that carry real dollar value beyond the paycheck.
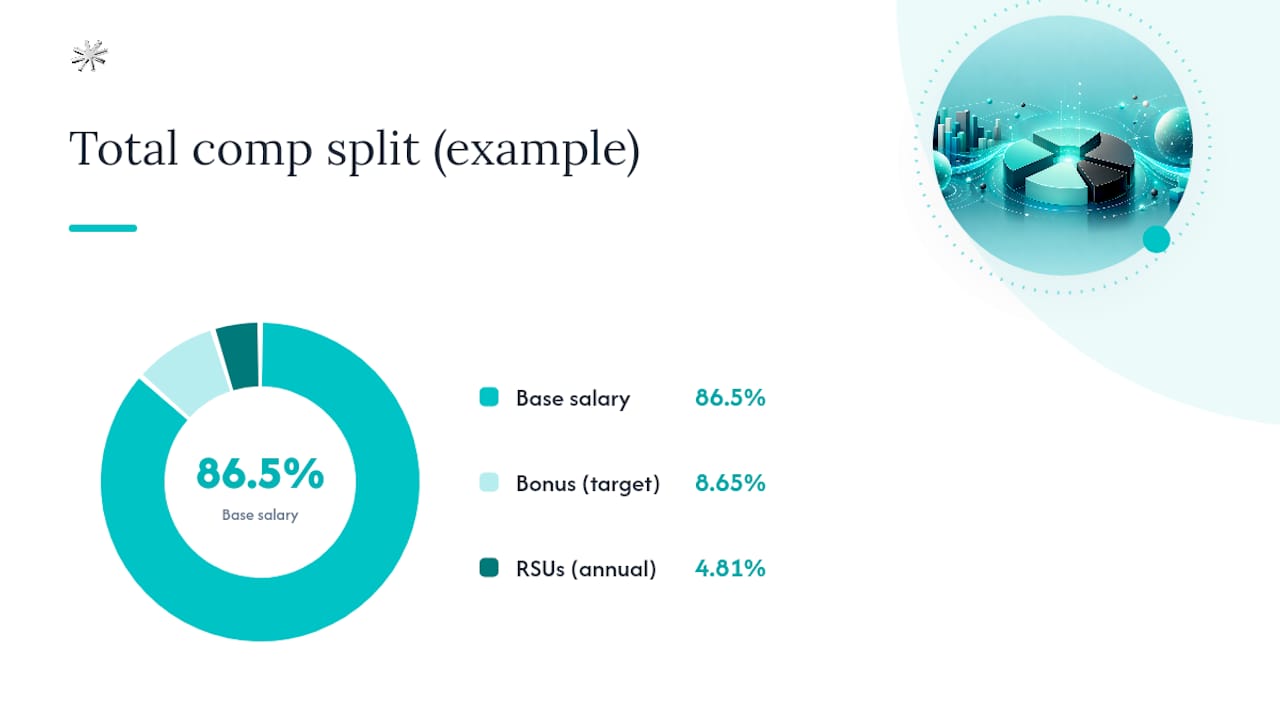
A $90,000 base offer with a 10% bonus and $5,000 in annual RSUs is functionally closer to a $104,000 total package, and that gap is exactly what candidates miss when they compare offers on base pay alone.
Before accepting any offer, run through this checklist:
- What's the guaranteed base versus target bonus?
- Is equity time-vested, and over how many years?
- What's the 401(k) match, and is it immediate or vested?
- What does health coverage actually cost you monthly?
Which Skills and Certifications Raise Data Analyst Pay the Most?
Not every skill you learn moves your salary. Some do it reliably; others are nice résumé lines that employers barely notice.
- SQL remains the highest-ROI skill. It's the baseline expectation for nearly every posting above entry level.
- Python or R with pandas signals you can handle analysis beyond spreadsheets.
- Data visualization tools (Tableau, Power BI) turn your analysis into something executives actually use.
- Domain expertise (healthcare metrics, financial modeling, marketing attribution) often out-earns general technical skill alone.
Certifications help most when you're pivoting industries or lack a traditional analytics background. They matter less if your portfolio already proves the skill. Training programs, including options like Canterbury Training and Development Institute's guidance on targeted credentials, can be a smart investment when they close a specific, provable gap.
Pro Tip: A certificate on your resume is a claim. A project in your portfolio with a measured business outcome is proof. Employers pay more for proof.
How Do You Negotiate a Higher Data Analyst Salary?
Negotiation works best when it's specific, timed well, and backed by numbers you can defend.
- Time it around performance reviews or offer stage, never mid-project when you have no fresh wins to point to.
- Bring market data, not just a number you want. Cite a range from multiple sources rather than a single figure.
- Quantify your impact in the same conversation. "I reduced reporting turnaround by 40%" lands harder than "I work hard."
- Consider external moves when internal raises stall. Switching companies often produces a bigger jump than an internal promotion, though it resets tenure and trust you've built.
Candidates who walk in with a 12-month roadmap of measurable contributions tied to a specific pay ask convert interest into real offers far more often than those who lean on vague claims about being a fast learner.
Pro Tip: Write your ask as a sentence you'd say out loud: "Based on my [specific project] and the median for this role in [city], I'm requesting $X." Rehearse it until it sounds normal, not rehearsed.
Why Salary Data Alone Won't Get You a Raise
Numbers tell you what the market pays. They don't tell you what you're actually worth to a specific employer, or whether data analytics is even the right ceiling for your strengths. That gap is where most people get stuck, benchmarking themselves against a role instead of asking whether a different path pays better and fits them just as well. NueCareer builds personalized roadmaps from a strengths assessment, not a title search, which is a meaningfully different starting point. If you're ready to see where your specific skills land on the pay scale, the 7-Minute Career Quiz is the fastest way to find out.
— Shane
Turn Your Salary Benchmark Into a Real Plan
Knowing the range doesn't tell you where you'd actually land in it. NueCareer's 7-Minute Career Quiz closes that gap by matching your strengths to specific roles and pay bands, including analytics paths you may not have considered.

The quiz takes seven minutes and gives you three concrete outputs: a strengths match, a list of target job titles suited to how you actually work, and a starting roadmap for closing skill gaps that matter most for pay. From there, you can prioritize the exact certifications or tools worth your time instead of guessing. Pair your results with tools like the job description analyzer to confirm a role's real scope before you negotiate against it. Take the 7-Minute Career Quiz now and see which pay band actually fits your strengths.
Where This Salary Data Comes From
- Glassdoor: self-reported pay data, source for median and percentile ranges.
- Indeed: job-posting-derived averages and range estimates.
- ZipRecruiter: self-reported averages showing market-wide variance.
- Salary.com: employer-reported survey data behind experience-tier progression bands.
Sources
- Data Analyst: Average Salary & Pay Trends 2026 | Glassdoor
- Data analyst salary in United States | Indeed
- Salary
FAQ
Is $80,000 a Good Salary for a Data Analyst in the US?
Yes. It sits close to the median across most major datasets and comfortably covers a middle-class lifestyle in most U.S. metro areas outside the highest cost-of-living cities.
Can a Data Analyst Make $200,000 a Year?
It's uncommon but possible, typically at senior or principal levels in high-paying tech or finance companies, often boosted by bonuses and equity rather than base salary alone.
Is Data Analyst a High-Paying Job?
It pays solidly above the national median wage for all U.S. occupations, though it trails specialized roles like data scientist or analytics engineer at the senior level.
How Much Should a Data Analyst With 5 Years of Experience Make?
Roughly $99,100 to $123,018 a year, based on Salary.com's Data Analyst III and IV bands, assuming steady growth in project scope and responsibility.